
Parametric Equations for a Woven Basket
By
Cassian Mosha
Questuon: For
various values of a and b investigate:
X=
cos(at)
Y=sin(bt) for 0![]()
Think
of a curve being traced out over time, sometimes doubling back on itself or
crossing itself. Such a curve cannot be described by a function y = f(x).
Instead, we will describe our position along the curve at time t by
x = x(t)
y = y(t) .
Then x
and y are related to each other through their dependence on the parameter t.
For example suppose we graph the following two equations
![]()
![]()
We
will get graphs that look like the one we see below.
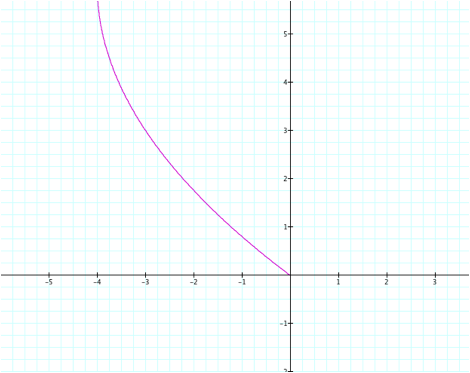
Figure1
t=1 and range of 0---->5
So, in
the same way we are going to explore the above two parametric equations and see
what kind of shapes can we get, and what it means in the world of explorations.
Now let's start exploring the equations, and the first set of values we are going to use will be a=0, b=0. In this case we would expect the cosine function will show something, but since cos 0 =1 it is just a point on the axis and t is not shown and sine of 0 is 0, so no graph was shown in that case. We will keep on changing the values and see what happens. For a=1,b=1, then the graph we get is a circle of radius 1 as seen below.

Figure 2 x=1, b=1, t 0----->5
When x=3, and b=3 we also get a circle of radius 3 and we can see a pattern here that for any value of a,b where a=b and they are integers we will get a circle of radius a=b. If we change the values of a and b for a=1 and b=2 we get a boe tie as seen below intersecting the x-axis three times at 0, 1 and -1, and the peaks of the tie being at y=1 and -1.
Figure 3, x=1. b=2 t 0--------->10
When we change the values of a,b to say a=3, b=5, we get a series of boe ties bound in the range between 1 and -1and domain of 1 and -1 as well as we can see it below.
Figure 4 a=3, b=5, t=1------->10
How about when x is a large even number say 12, and b is an odd nunber say 15? the graph we got is as shown on the figure below.
Figure 5 a=12, b=15 t=0----10
Let's now interchange the values we have used so far and see how the shapes of the graphs change nd what kind of shapes or figures we get. We will start with figure 3 since we saw before that equal integers will give the same shape; that is the circle.If a=5 and b=3, or if a=15 and b=12 what kind of graphs do we get?
Figure 6 a=5, b=3
Figure 6a x=15, b=12
Interestingly the shapes looks similar like the Zimbawean woven baskets used to teach mathematics. The shapes we got here both looks like figure 4 but figure 6a is completely different to figure 5, and so show some big difference we can observe in analysing parametric equations. Lets now lookat the rational numbers and see what we will get and start drawing some conclusions. If a=1/2 and b=1/2 both even rationals we get a circe again, and all fractions as long as they are the same we will always get a circle. We tried values of 1/2, 1/3, 1/4, and 1/8 for both a and b and we found a circle with the readius of 1. For the fraction rational values that were different say a=1/2 and b=1/4 we found a parabola opening sideways with the vertex at the x-axis. The graphs below illustrates the shapes on discussion.
Figure 7 x=1/6 b=1/6 t=0-----60
Figure 7a x=1/2, b=1/4 t=0-----60
After looking at all these different graphs we can conclude it with some few observations that:
1) Equal values of a and b results into a circle whether integers or fractions
2) There is no relationship between increasing values of a and the shape of the graph. Sometimes small value of a creates more lines in the graph, and sometimes less. If you compare when a=3 and when a=12 the graphs looks different and you can not pin point a definite realtionship between the two.
3) In all cases any graph that we sketched created curves along the x-axis and y-axis, and in some cases the interchanging of the values rotate the shape of the graph and show a different shape eg the case of boe tie series to woven baskets spotted in Zimbabwe.
4) Even values of a such as a=2 produces incomplete graphs, although as you increase t interval the graph appears complete. But when a is an odd value the number of curves equals the value of a and the graphs extends along the y-axis as opposed to x-axis.


